Identifying digital friction for the worlds leading poker brand.
PokerStars advertising campaigns were not delivering. Regulation across the European market meant that the customer sign up journey had become fragmented and mis-aligned.
PokerStars needed solutions to optimise their marketing spend. This included the identification of ‘quick wins’. Items that could be solved with minimal development or engineering effort.
This would be accompanied with longer term strategic and UX recommendations that would improve initial customer deposit and first time game play length.
Approach.
The project for PokerStars was planned and executed over an eight-week timeline. The project was broken down into three simple phases;
Discover
Map
Recommend
The discovery phase largely consisted of customer testing interviews and desk research. Eighteen interviews were undertaken across the UK, Germany and Portugal with a focus towards the onboarding experience from advertising to a monetary deposit in-game and first play. Interviews were conducted in an observatory capacity, setting users tasks to complete and monitoring friction points. This enabled the tracking of blockers that would have ended the journey were it not for facilitation intervention.
The user tests were accompanied by an in-depth expert desk review of the onboarding. Where an improvement could be made, the step of the journey was captured and recorded and added to a product backlog.
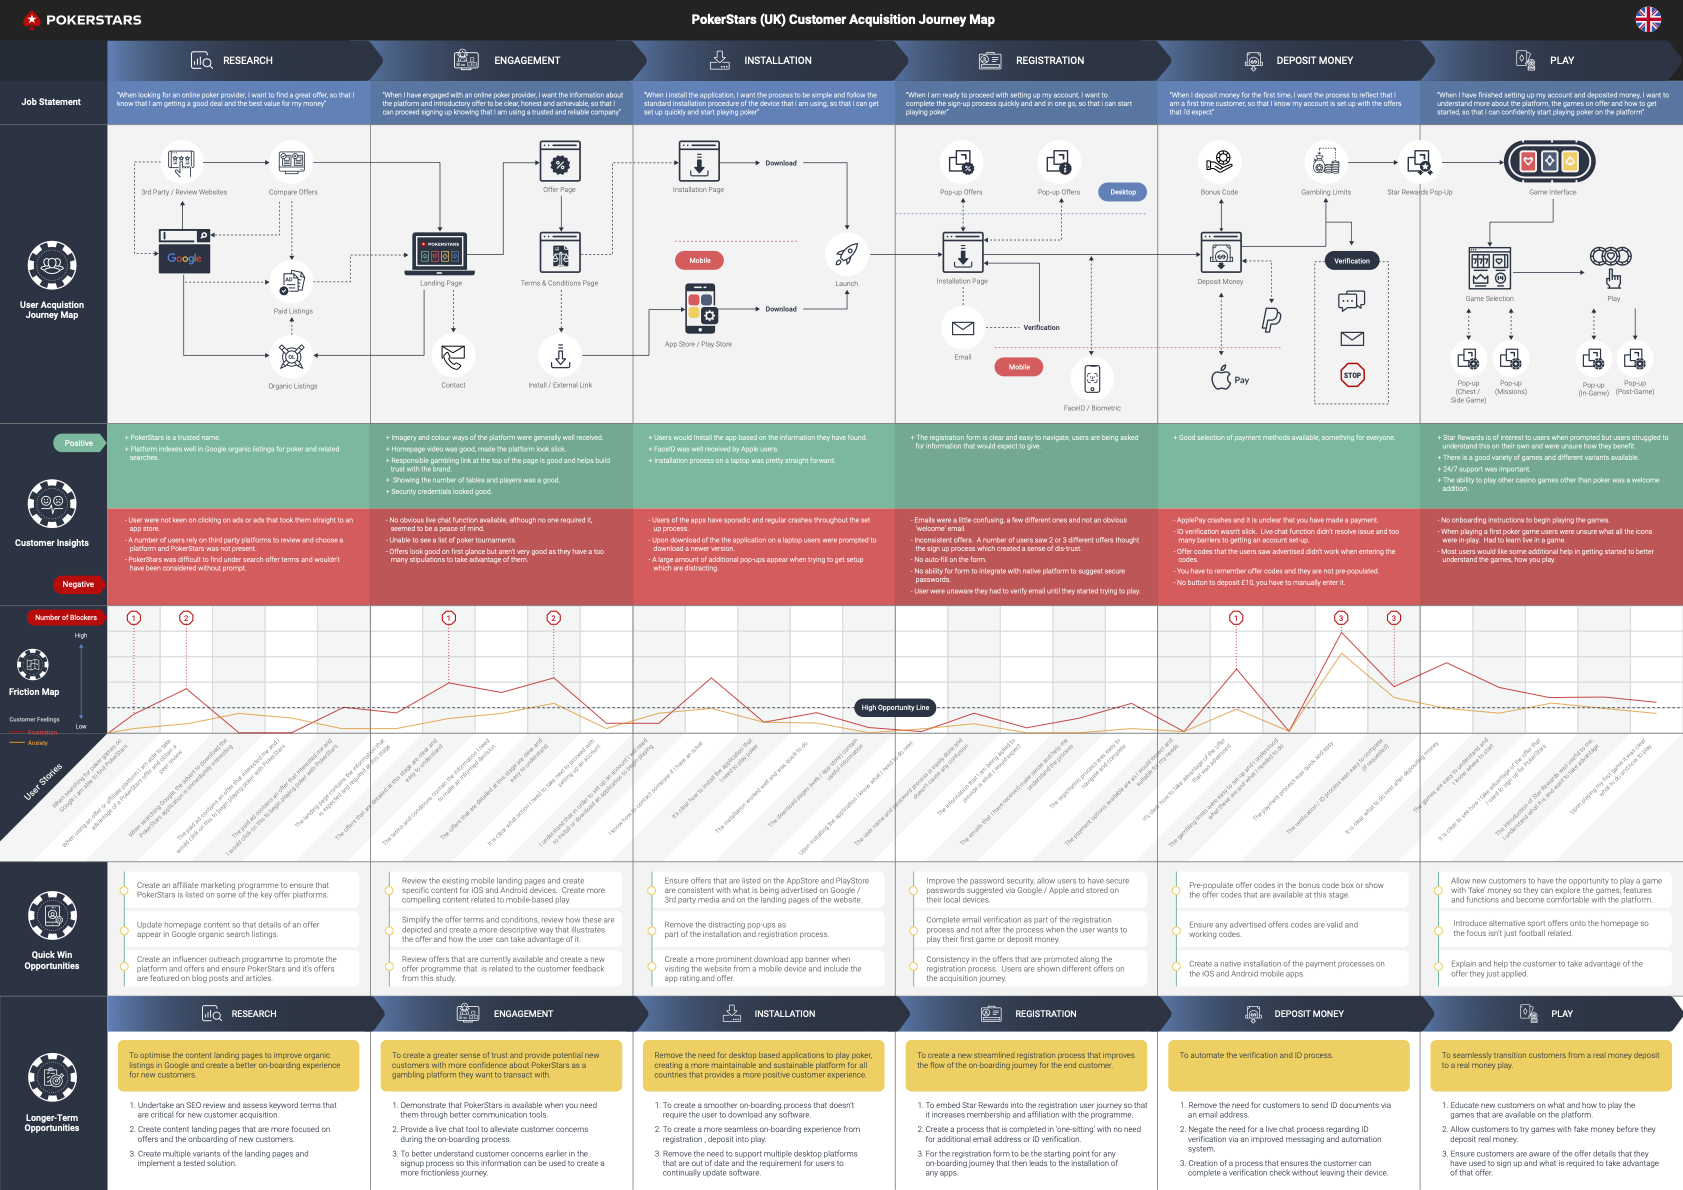
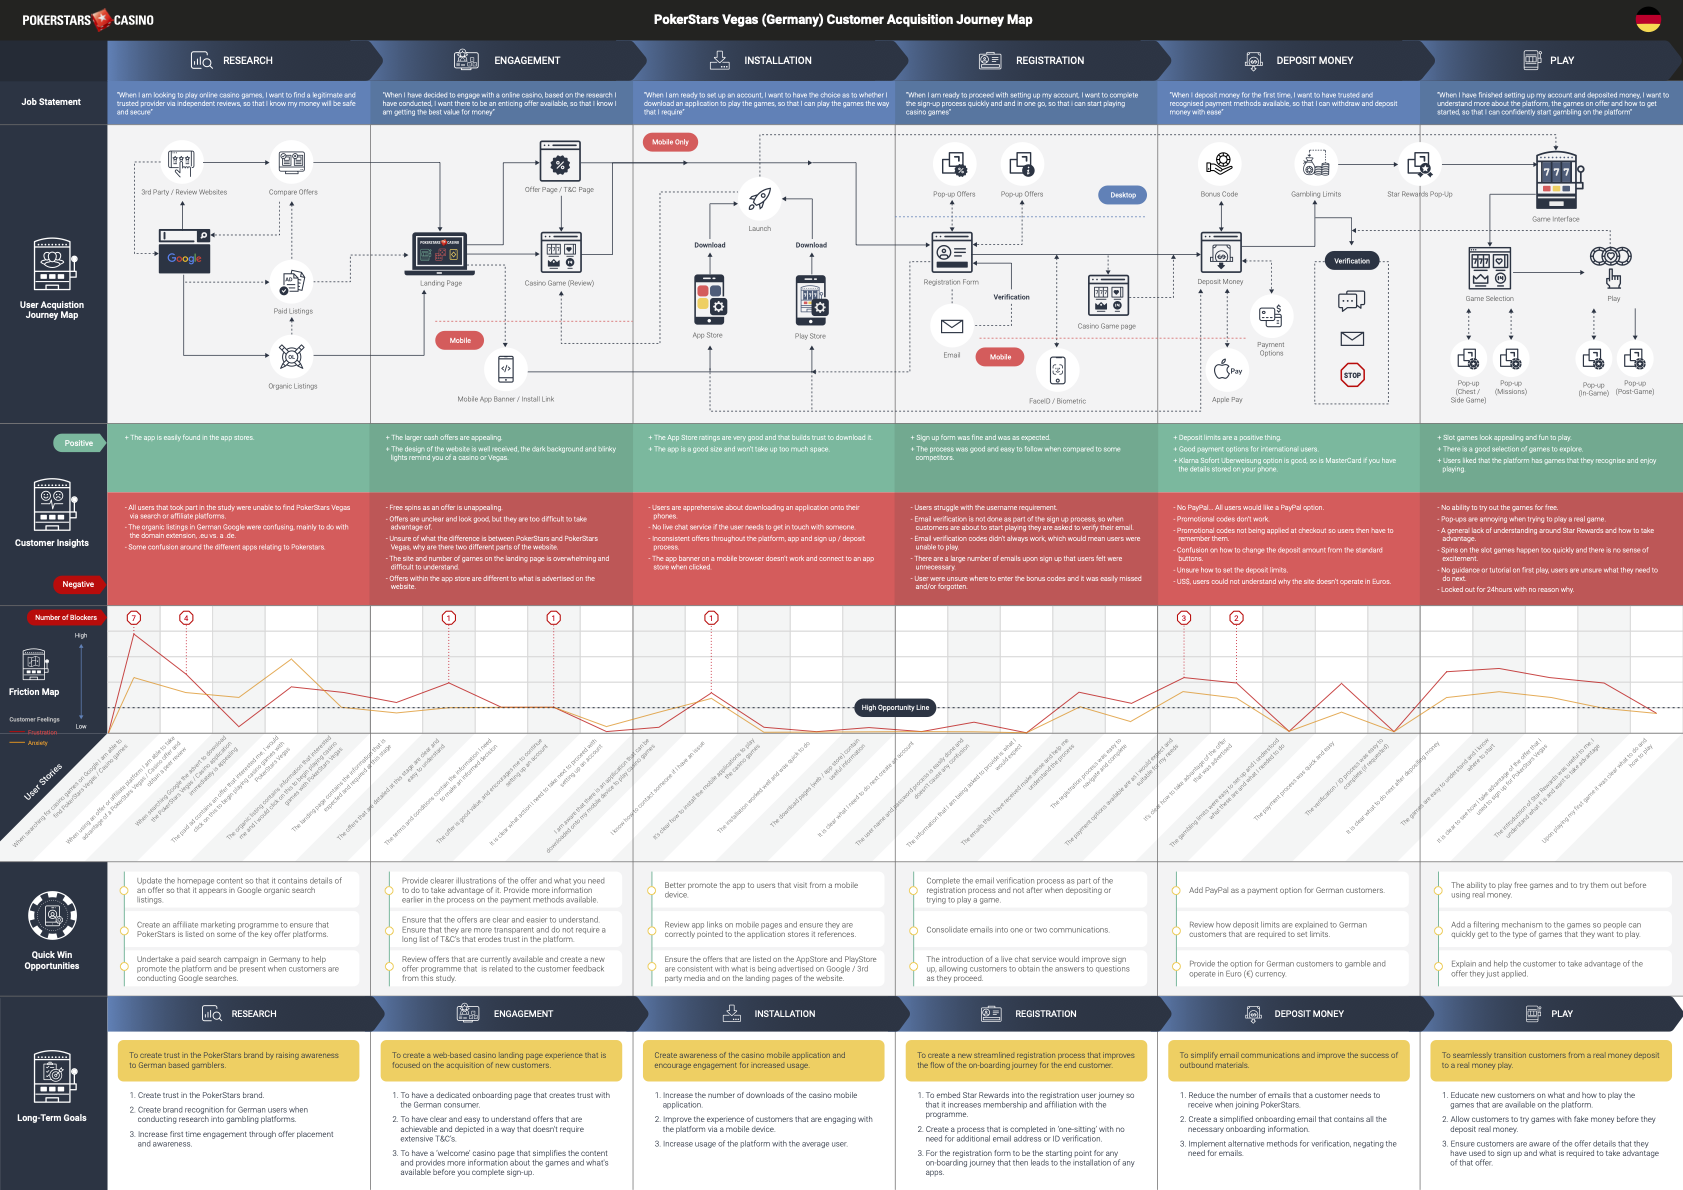
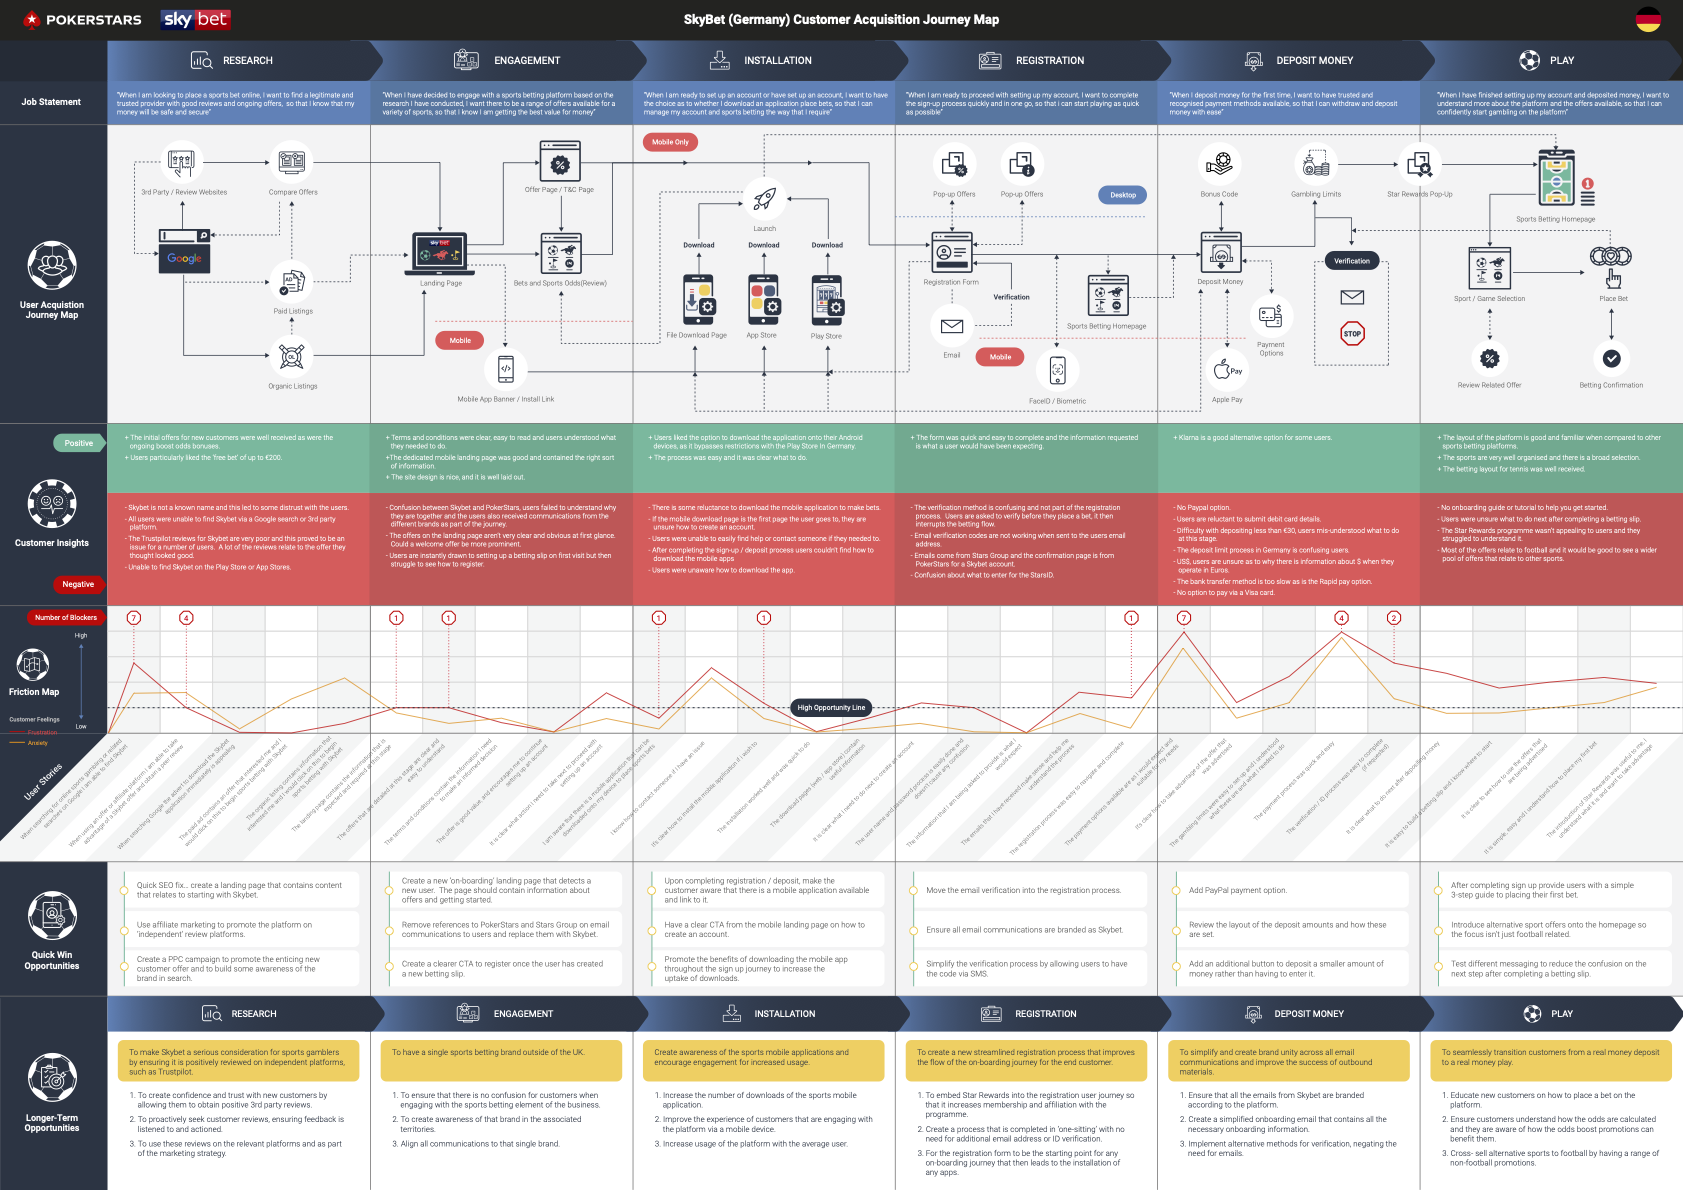
Once all the research was undertaken, a detailed onboarding journey was mapped and segmented using jobs to be done framework statements to determine the customers desired outcome at a particular point in the journey. The customer’s experience was then mapped against two core emotions that would affect the deposit of cash in a gambling transaction; anxiety and frustration. Core blockers were also recorded to highlight the likely abandonment rate if it weren’t for the intervention of the facilitator.
Using the research conducted a total of 280 improvements were recommended. These were distilled down into the top three for the experience map and accompanied with a longer term UX recommendation that would have a greater impact to revenue generation.
The final output was three detailed visual maps, a stakeholder presentation of each of the countries and platforms that were assessed, and a product backlog of the quick wins that had been assessed for both design and development complexity.
Outcome.
Overall 280 user experience issues were identified across three different platforms in three different countries. UX issues were graded with t-shirt sizing and technically assessed for difficulty and feasibility. Many of the quick wins could be implemented through content and layout changes within the CMS platform. Improvement seen on advertising performance across the countries that it was implemented.


Methods & Tools.
The information below details a selection of the methodologies, techniques and tools used to deliver the project..
Methods
Customer journey mapping
Acquisition assessments
UX issue identification
User acquisition testing
Friction mapping
Opportunity identification & mapping
Job story & segmentation development
Quick-win recommendations
Long-term CX recommendation
Implementation plan
Product backlog creation
Stakeholder presentations
Tools
Mural
Lookback.io
Powerpoint
Excel
Teams
Ad-lib Value Proposition Canvas
Express VPN